Figure 1 | Figure 2 | Figure 3 | Figure 4 | Nibert Lab Resources
View a high-resolution version (1 MB) in a new browser window
|
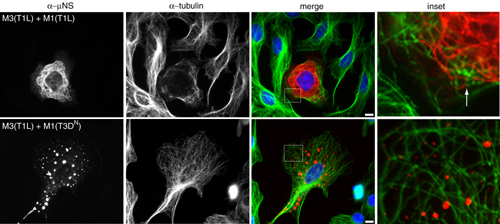
Supplemental Fig. 3. Distribution of muNS(T1L) and beta-tubulin in cells coexpressing muNS(T1L) and mu2. CV-1 cells were transfected with 1 microgram of pCI-M3(T1L) and 1 microgram of pCI-M1(T1L) (upper panels) or 1 microgram pCI-M3(T1L) and 1 microgram pCI-M1(T3DN) (lower panels) per well. Cells were fixed at 18 h p.t. and immunostained with Oregon green-conjugated anti-muNS rabbit IgG (red) (left column) and Cy3-conjugated mouse monoclonal antibody to beta-tubulin (green) (center left column). Nuclei were counterstained with DAPI (blue). The boxed areas in the merged images are enlarged to show detail (inset). Colinearity of muNS and tubulin is indicated by the arrow. Scale bar, 10 microns. |