Figure 1 | Figure 2 | Figure 3 | Figure 4 | Nibert Lab Resources
View a high-resolution version (360 KB) in a new browser window
|
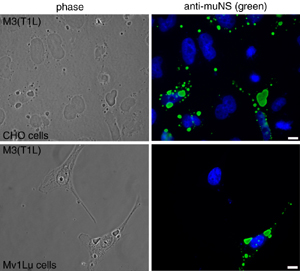
Supplemental Fig. 1. Distribution of muNS(T1L) in transfected CHO and Mv1Lu cells. Phase-contrast (left column) and immunofluorescence (right column) microscopy of CHO cells (upper panels) and Mv1Lu cells (lower panels) transfected with 2 micrograms of pCI-M3(T1L) per well. The cells were fixed at 18 h p.t. and immunostained with rabbit anti-muNS IgG directly conjugated to Oregon green (green). Nuclei were counterstained with DAPI (blue). Scale bar, 10 microns. |