Figure 1 | Figure 2 | Nibert Lab Resources
View a high-resolution version (100 KB) in a new browser window
|
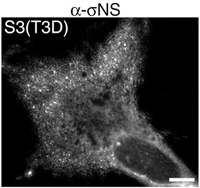
Supplemental Fig. 1. Distribution of σNS(T3D) in transfected CV-1 cells. Immunofluorescence microscopy of CV-1 cells at 18 h p.t. with pCI-S3(T3D). σNS was visualized by immunostaining with σNS MAb 3E10, followed by Alexa 488-conjugated goat anti-mouse IgG. Scale bar, 10μm. |